Find slow pages in Matomo
Check page load time in Matomo. Find slow URLs, understand network, server and browser timings, then investigate the pages that need attention.
Content checked on 08.11.2026
At a glance
Matomo analyses timings from recorded browser pageviews. Check the specific URL and its timing stages. Server time also includes network latency; missing or very small values do not reliably prove that a page is fast.
In this article
The website average may look ordinary while an important service page loads slowly. The Performance report helps you identify a specific URL and the stage worth examining. That gives your website maintainer a more useful starting point than “the website is slow”.
Check page load time for a specific URL
- Open the full Matomo interface from your speo account. Choose the website and an appropriate date range.
- Go to Behaviour > Performance. The overview shows combined values; tables by page URL and page title appear below it.
- Find the page in the URL table. Expand its domain and folders if necessary. Compare its Avg. page load time with the individual timing stages.
The URL table is usually clearer when investigating a single page. Several addresses may share the same page title. Keep the full URL and the date range you examined.
Understand the stages of page load time
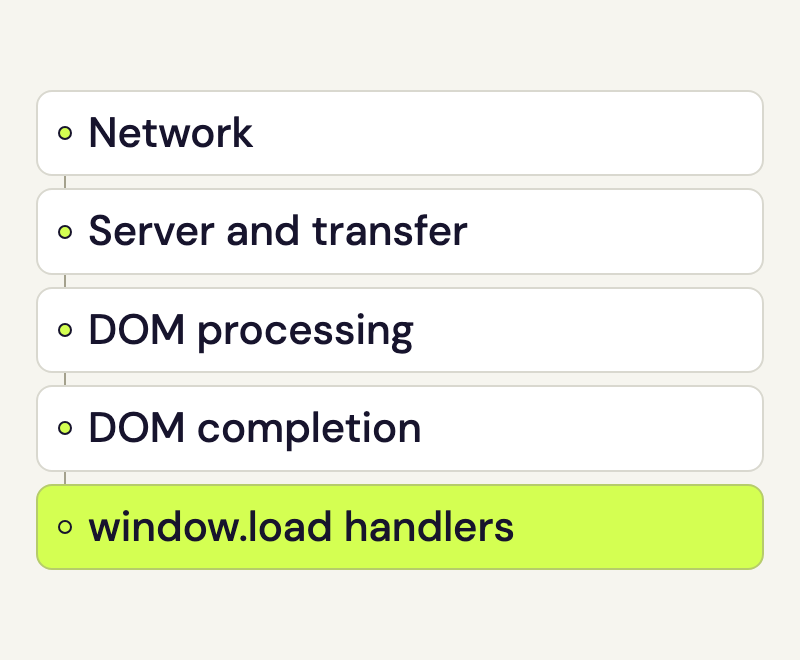
The values come from browser timing measurements on recorded pageviews. They describe different parts of loading. Read the report labels as follows:
- Avg. network time: preparing the connection to the server, such as looking up its name and establishing a connection. Reusing a connection may take very little time.
- Avg. server time: the time between sending the document request and receiving the first response data. It includes network latency, so it does not measure web-server processing alone.
- Avg. transfer time: transferring the response to this document request, usually the HTML document. It is not the full loading time of every image and other resource on the page.
- Avg. DOM processing time: processing the document until it becomes interactive. Document structure and scripts being executed can contribute.
- Avg. DOM completion time: the additional period from an interactive document to a complete document state. Media or scripts still loading can contribute.
- Avg. on load time: this component records execution of handlers for the
window.loadevent. Do not confuse it with the report’s combined page-load time.
Avg. page load time combines the recorded average timing stages. It is a time indicator derived from those browser measurements. It does not provide a performance score or a Core Web Vitals value.
Investigate unusual page load time values
On a rarely viewed page, one unusual request can have a strong effect on the average. Choose a suitable longer date range and consider how regularly the page is visited. Browsers and devices do not always supply every timing; each average uses the available measurements for that component.
Caching, connection and device can change the values. After a release, for example, new files may need to be loaded for the first time. Compare that day with a period of repeat visits only when you have accounted for the difference.
Reproduce the issue
- Open the specific URL on the type of device where the problem is suspected. Check a first visit and a repeat load separately.
- Describe the visible delay: is the response late, does content appear slowly, or is a control slow to respond? Give your maintainer the URL, device and observation alongside the timing stage that stood out in Matomo.
- After a change, test the same content again. Compare appropriate report periods too, noting any changes in where visits came from or the mix of devices.
Your maintainer can investigate the technical cause with browser developer tools or a separate performance test. Those measurements complement Matomo; keep their conditions and metrics clear when comparing them.
If timings are missing or zero
An empty column, a dash or zero seconds does not prove an instant display. A browser may not supply a particular timing, or the connection may already exist. A partly recorded pageview can also be missing values.
If ordinary pageviews are present, have the browser timing transmission checked. If visits themselves are missing, start with the Matomo tracking check. Rocketsky handles changes to the shared Matomo and server configuration.
Sources
- How do I see Page Performance reports?
- Understanding Page Performance Metrics
- Why Page Performance reports show zero or very high processing time
- Matomo 5.14.2: Browser performance timing collection
- Matomo 5.14.2: Average performance metrics
- Matomo 5.14.2: Page-load time calculation
- Matomo 5.14.2: Performance report and URL tables